 Few days ago Microsoft released the technical preview of it’s Windows Server and System Center stack. One thing I am very interested in is SCOM, if there is anything new. To download all new TP 5 products see these links…
- Find all System Center 2016 TP 5 here
- Find Windows Server 2016 TP 5 here
The known new features are the following…
Alert Data Management
If you have been working with SCOM for a while you know, that tuning SCOM is not a thing that you can do once and then it is done. Tuning is a a process in a SCOM admins daily life, which takes some time, but if you do it periodically / daily SCOM and the result will be a monitoring environment that is alerting whenever there is a REAL issue. Microsoft is providing a new capability which will support you in tuning your environment.
There is a new task in Administration/Management Packs/Tune Management Packs which is called Identify Management Packs To Tune. If you run this task you are able to set a date range and an alert count, which shows you then the management packs which have generated the minimum number of alerts entered. In my environment I don’t have many alerts yet, so I entered the date today and minimum alert count 1. The corresponding MP which generated alerts according to your criteria will appear…
 The Properties menu will show you properties of the MP. Tune Alerts will pop up a new Window, which shows the alerts caused to break the previously set threshold…
 If you click View or edit the settings of this monitor, you’ll see the known monitor settings…
 View or Overrides Sources shows you the source generating the alert, from here you are able to override or disable the monitor…
 The Overrides menu gives you all the known options…
 I like this new handy option, it will let you do few steps in a single place and provide some additional help for tuning your environment. In summary it provides you the following features:
This information enables you to make informed decisions on tuning the thresholds or disabling the alerts which you consider noisy.
Management Pack Updates and Recommendations
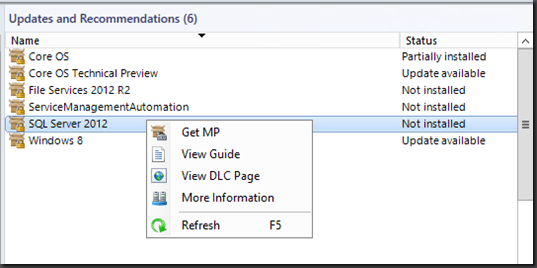
The next new feature is Updates and Recommendations, which you also will find in Administration/Management Packs/Updates and Recommendations. I have deployed agents to a domain controller, SMA and SQL Server. In addition, I have only imported the core OS management packs. The result is, that SCOM recommends installing MP’s for the technologies, I have mentioned and in addition I get recommendations for updating management packs.
If you right click one of the entries, it gives you some options like Get MP, this will launch the MP import wizard and install the selected MP. View Guide will download the management pack guide for the selected MP. The View DLC Page opens the download catalog (DLC) page of that specific MP….
…and finally More Information shows you the system which is running the workload…
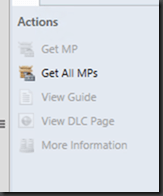
In the Actions pane you will find also a task to download all MP’s at once…
In summary, this new feature shows your workloads, which are currently not monitored by a SCOM management pack or maybe not running the latest management pack. This is also a nifty little feature which will generate more value to the SCOM administrator. There are also detailed instructions on TechNet.
Scalability Improvement with Unix/Linux Agents Monitoring
According to Microsoft TechNet a SCOM 2016 management server will be able to monitor twice as much Unix/Linux agents as SCOM 2012 R2. What does that mean? There is a new Async Windows Management Infrastructure (MI) API that seems to have better performance than the previous WSMAN Sync API. In SCOM 2012 R2 we were able to monitor 500 agents (supported scenario)…
…if we do the math in SCOM 2016 we should be able to monitor about 1000 Unix/Linux agents. To be able to use the new API you need to edit the registry on the management server like this…
If you have a larger Unix/Linux farm to monitor, this will save you half of the management servers needed to stay in a supported scenario.
Maintenance Schedules
The problem since I can remember is, that there is no way to schedule maintenance mode in the future. We always had to create some sort of scheduled task and PowerShell scripts, which was not very elegant. In SCOM 2016 TP2 Microsoft introduced Maintenance Mode Scheduler in Administration/Device Management/Maintenance Schedules. You are able to put single objects or objects and all it’s containing objects into maintenance mode using an advanced schedule…
If you want to know more about this feature see my previous post here https://stefanroth.net/2015/05/06/scom-2012-r2-technical-preview-2-whats-new/. This was a long awaited feature and I am happy it is still in TP5 available :).
Monitoring Nano Server and Workloads
You might heard of Nano Server which is the latest, greatest and foremost boiled down Windows Server that we have seen up to this point. It is an optimized version of Windows Server for private cloud and datacenter operations, that will have only have software running that is really needed to fulfill its duty. If you are interested in Nano Server start here. From a SCOM point of view we are able to monitor this server. As you can imagine there needs to be a special agent to be running on such a slim server. In SCOM 2016 TP 5 we are able to push the agent from the console to Nano Server and are able to monitor the following workloads:
- Monitor Internet Information Services (IIS) and Domain Name System (DNS) roles
- Supports ACS security audit event collection
To get detailed instructions how to deploy and monitor Nano Server see this article on TechNet .
Partner Program in Administration Pane
Another new thingy is the Partner Solutions feature, this allows registered and certified System Center Operations Manager partners to “promote” their solutions, so you can get it directly from their home page. It is a nice little catalog for extending your SCOM.
Extensible Network Monitoring
Until now when you tried to monitor a network device, your monitoring experience was depending on Microsoft, how well the support for that specific network device was. In a worst case scenario you just could monitor “up and down” of the network device via SNMP and in a best case scenario you would get very detailed information about memory, CPU, interfaces etc. which is known as extended network monitoring. A requirement was that your device was certified by Microsoft to have a deep level of monitoring. If you want to know which devices are certified and what information you get see this spreadsheet here.
In SCOM 2016 TP5 Microsoft delivers a tool which let’s you create a your custom MP which will allow to monitor insights of your network device. As an input you could provide an XML file and the corresponding OID’s which you would like to monitor. There is not much info out there yet, but as soon there is an example how the XML should look like I will write a post about it. Microsoft itself provides just a small blog post here.
The tool is located in %Program Files%\Microsoft System Center 2016\Operations Manager\Server.
Usage
NetMonMpGenerator.exe [OPTIONS] -InputFile <XML Input File Name>
OPTIONS:
- -InputFile, –I
- Name of input xml file
- -OutputDir, –O
- Directory where output MP has to placed
- -Overwrite, –W
- Overwrite existing MP
- -Help, -H, –?
- Print this usage
Console User Interface Performance Improvements
Microsoft improved also console speed. I haven’t tested the console experience in a full blown scenario, but what I have experienced clicking around in the SCOM console feels more crisp. According to Microsoft they improved the alerts view experience.
Conclusion:
I like the new feature Alert Data Management and also Management Pack Updates and Recommendations, I think it will provide value to the SCOM administrator. Extensible Network Monitoring and Maintenance Schedules will probably bring the most benefit so far. I was hopping to see more urgent features and fixes in SCOM 2016 TP5 as requested on UserVoice, there is a whole list of it https://systemcenterom.uservoice.com/forums/293064-general-operations-manager-feedback . Well there is still some hope, to see some more new features in the final release, let’s pray:).


Do you know when the Final release should be of SCOM 2016?
Do you know when the Final Release of SCOM 2016 should be?
Hi
Probably Q3 https://rcpmag.com/articles/2011/02/01/the-2011-microsoft-product-roadmap.aspx
Cheers,
Stefan